Own the experience.
Not just the dashboard.
Stop watching dashboards. Declare the experience outcomes you own — and let full-stack observability + digital experience monitoring, correlated by Ritam, hold them true across every user journey.
FSO answers “why, and where in the stack.” DEM answers “what the user is feeling.”
You learn about bad experience from your customers.
Experience is managed reactively — the platform is green while users abandon, buffer and churn. Front-end tools can't see the backend; backend tools can't see the user. No one owns the outcome.
Experience, managed by goals — not dashboards.
You declare the experience outcomes you're accountable for. CraftDEM measures them in real time, sees the full stack beneath them, and — through ARGUS — tells you why you're at risk, before the customer feels it.
FSO + DEM — outside-in and inside-out, unified.
Two co-equal pillars on one substrate. DEM sees the experience from the user's side; FSO sees the entire stack that produces it. ARGUS correlates between them so a bad experience always resolves to a real cause.
Digital Experience Monitoring
Full-Stack Observability
Own the number.
You set the experience goals you're accountable for; CraftDEM tracks target vs realised, and Ritam flags what's at risk — with the full-stack cause already attached, long before users feel it.
| Experience goal | Target | Now | Status |
|---|---|---|---|
| Checkout success rate | > 99.5% | 99.2% | At risk |
| Login p95 latency | < 800 ms | 610 ms | On track |
| Video start time (p90) | < 2.0 s | 1.7 s | On track |
| API error rate | < 0.5% | 0.31% | On track |
| Core Web Vitals (good) | > 90% | 84% | At risk |
Experience means something different in each vertical.
BFSI, OTT and SaaS experience models out of the box.
Experience is transaction integrity
For a bank, digital experience is trust: every login lands, every payment completes, every balance loads instantly — under RBI and DPDP scrutiny.
Experience is quality of viewing
For a streaming service, experience is the stream itself: fast starts, no rebuffering, stable bitrate — especially when a live event spikes concurrency.
Experience is product usability
For a SaaS product, experience is whether the app feels fast and works: responsive flows, low error rates, completed onboarding — the things that drive activation and renewal.
From “the app is slow” to the exact cause — in one view.
A single experience symptom, traced through the full stack to one root cause. No front-end-vs-backend standoff — ARGUS follows the request across every hop.
Real users see checkout latency climb +2.1 s — DXS for the flow drops 11 points
Distributed trace isolates the slow span to the payments micro-service
eBPF shows the service blocked on a DB connection-pool wait, not CPU
Root cause: pgbouncer pool exhausted by a deploy 20 min earlier. One cause, not five theories.
eBPF + OpenTelemetry — deep, without agent sprawl.
CraftDEM instruments the full stack with eBPF and open standards — no code changes, no per-host agent zoo — and augments the APM and RUM tools you already run rather than replacing them.
eBPF kernel-level capture
Sees every syscall, socket and DB call with near-zero overhead — no app instrumentation required.
OpenTelemetry-native
Traces, metrics and logs on open standards — no lock-in, works with your existing pipelines.
Augments, doesn’t replace
Sits above Datadog, Dynatrace, New Relic — adds the experience-goal layer and cross-stack correlation.
See CraftDEM in action.
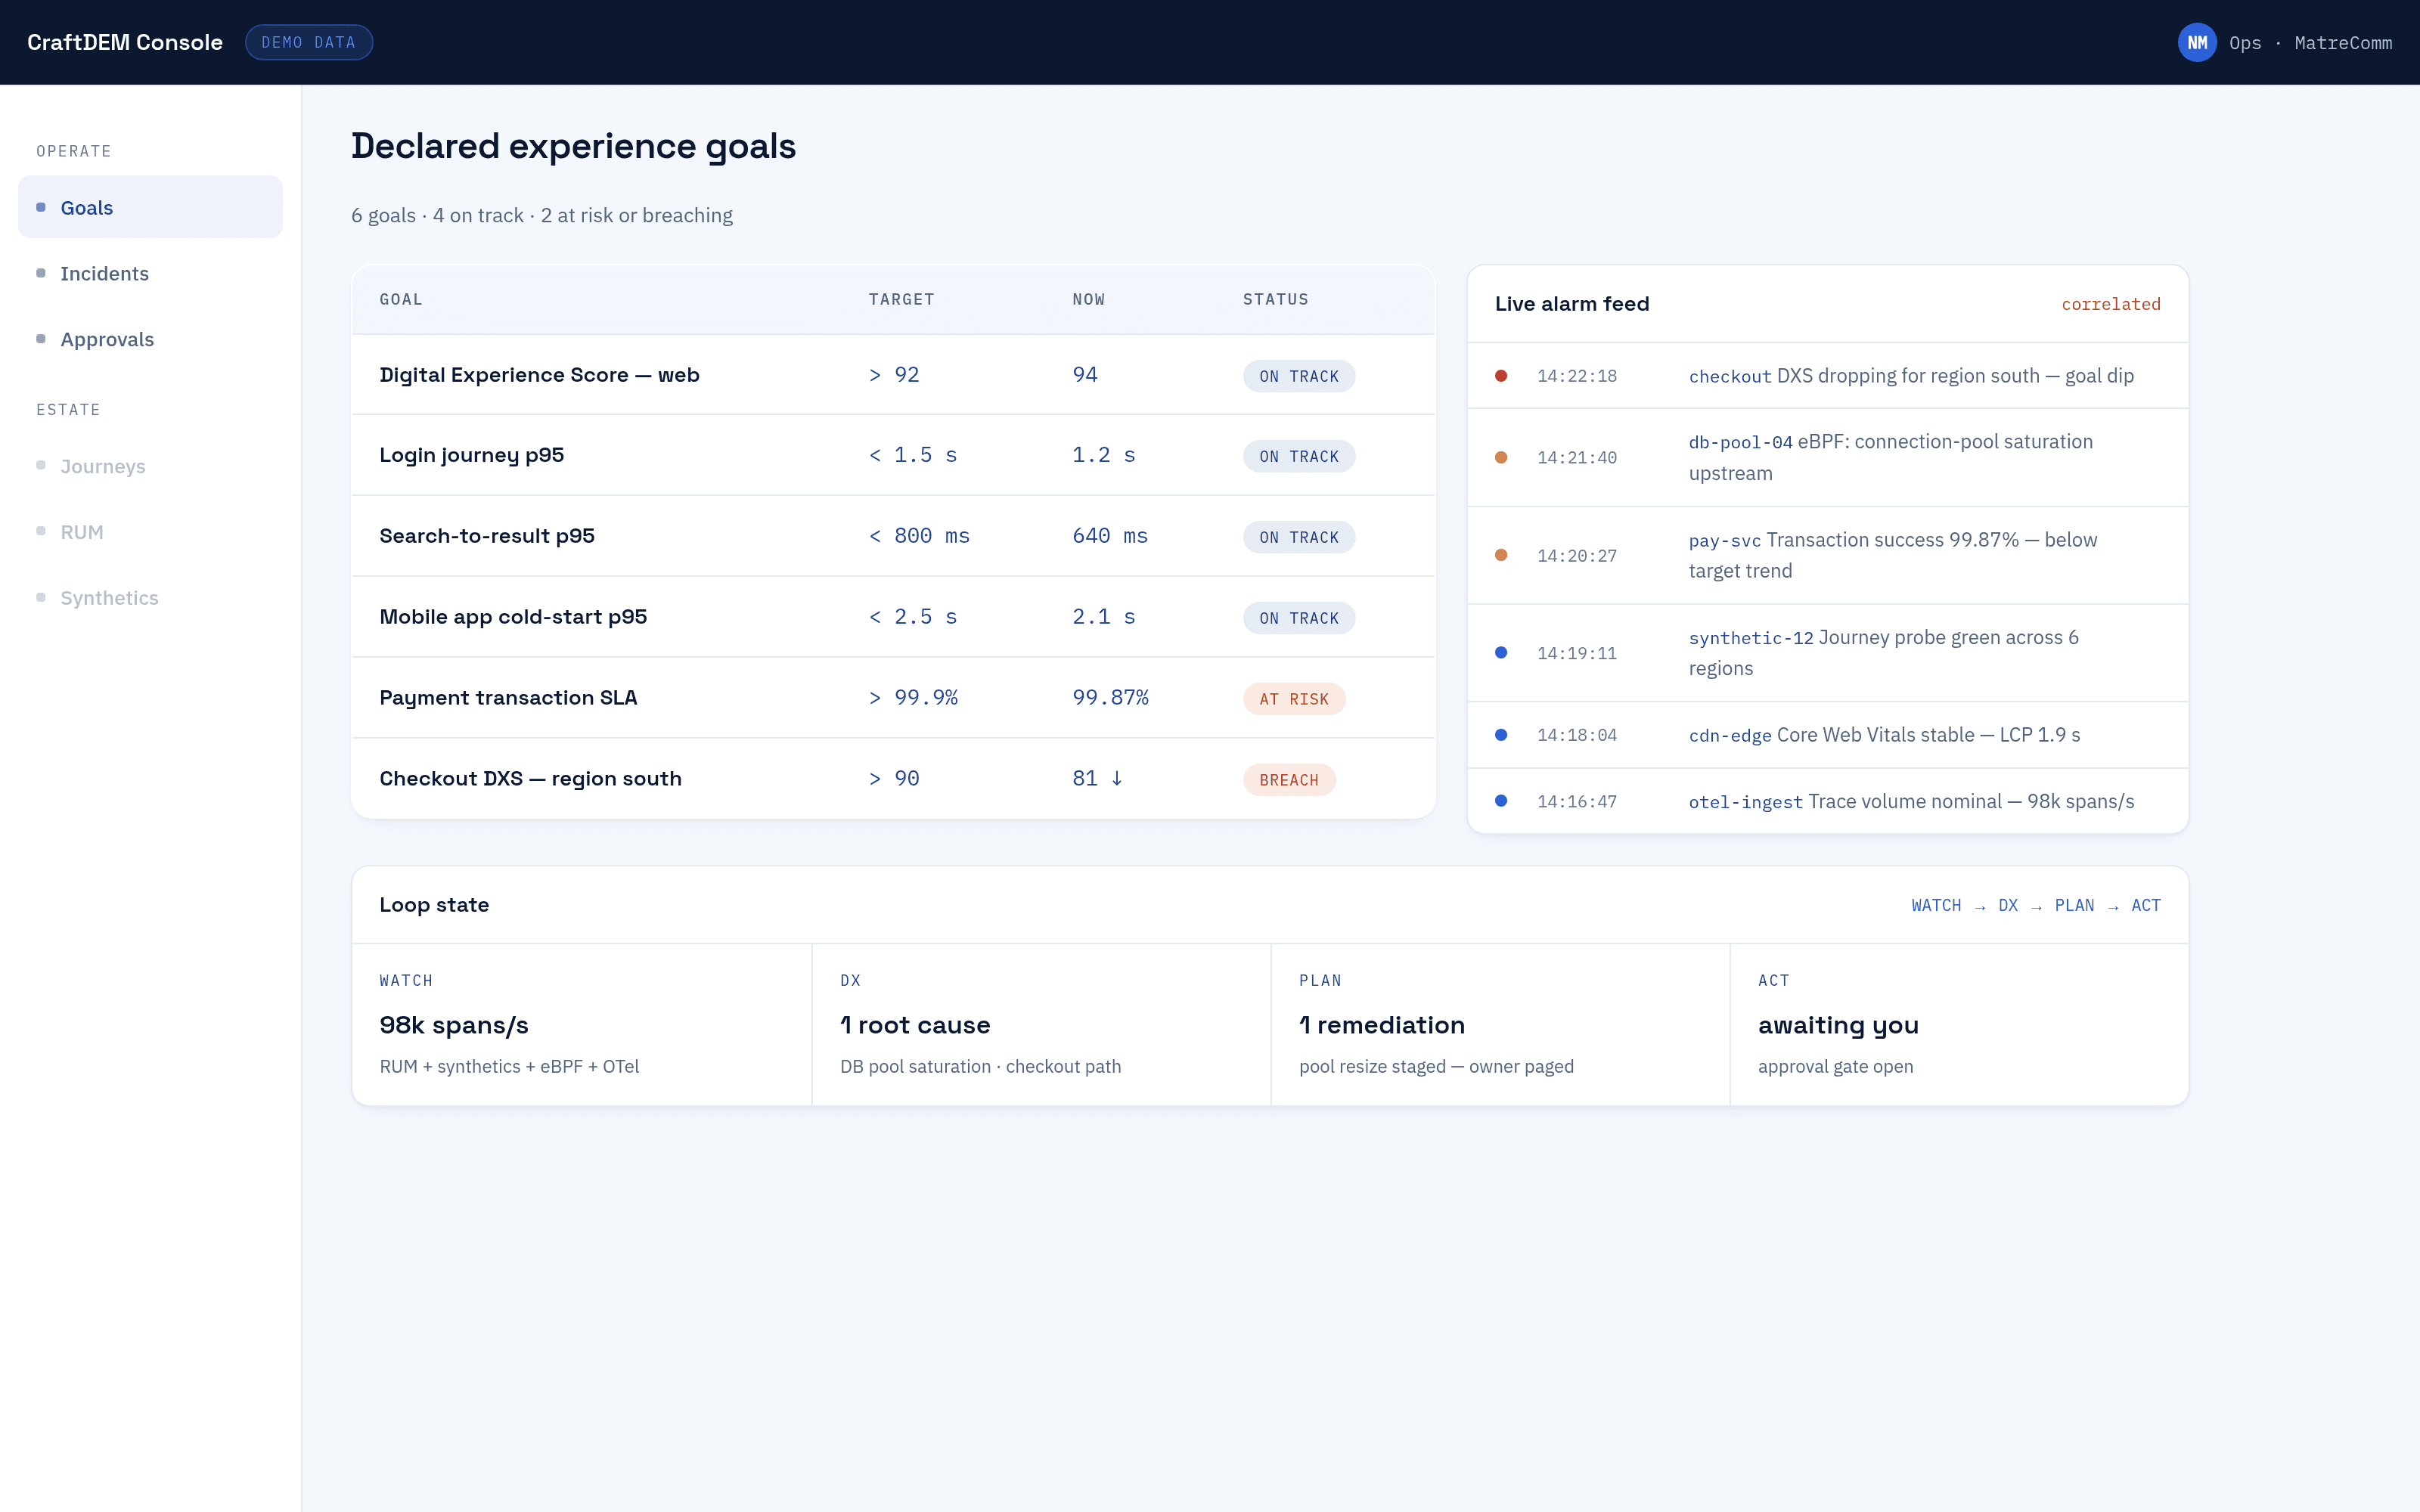
The DXS dashboard — experience goals, at-risk journeys and the full-stack trace behind each.
What goal-driven experience delivers.
From reactive monitoring to owned outcomes — measurable from the first quarter, across every vertical.
[ ] bracketed values to confirm against account baseline.
A de-risked path — delivered with your SI.
Every stage is co-funded, KPI-gated and reversible. For large accounts we deliver through your Tier-1 SI partner — you keep your prime, we bring the programmable layer.
Experience workshop
Map your critical journeys and declare the experience goals that matter. Baseline current DXS, RCA time and tool sprawl.
You bring: Journey list · current tooling
Instrumented PoC
eBPF/OTel deployed on 2–3 real journeys. Goals tracked live against KPIs agreed upfront.
You bring: Co-funded PoC · data-feed access
Full rollout
Experience goals across the estate, ARGUS RCA and at-risk flagging live. SI-delivered, augments your APM stack.
You bring: SaaS fees · zero additional CapEx
The programmable enterprise suite.
Three surfaces, one AIOps engine underneath — Ritam. Prove one, extend without re-integrating.
CraftUnify
Program the whole estate by intent.
Explore →CraftDEM
Own the experience number, full-stack.
You are hereCraftCompliance
Hold your posture true, continuously.
Explore →The experience console.
DXS score, a journey at risk, and the correlated full-stack RCA trace.
Frequently asked questions
What is CraftDEM?
CraftDEM is MatreComm's goal-driven digital experience management and full-stack observability platform. Every user journey and every layer of the stack correlate to a single cause through the Ritam AIOps engine, and experience is managed as a declared goal expressed as the Digital Experience Score.
What is the Digital Experience Score?
The Digital Experience Score (DXS) is CraftDEM's single measure of end-user experience. It combines journey completion and failure outcomes, latency and responsiveness at each stack layer, and error and availability conditions across the path, weighted by MatreComm's proprietary model. Publishing the inputs means you can see what moves the score; the weighting is what makes it comparable across estates. Its purpose is to give experience a number that can be declared as a goal and held.
Who is CraftDEM for?
CraftDEM is built for BFSI organisations managing transaction integrity under RBI and DPDP scrutiny, OTT and streaming providers where rebuffering drives churn, and SaaS companies where experience quality maps to activation and net revenue retention.
Does CraftDEM replace our existing APM stack?
No — CraftDEM augments it. CraftDEM correlates across your existing tooling, adding full-stack visibility and single-root-cause identification above the instrumentation you already run. It is delivered with systems-integrator support, so correlation against your specific stack is part of the engagement.
What technology does CraftDEM use for observability?
CraftDEM uses eBPF and OpenTelemetry for full-stack instrumentation, unified with digital experience monitoring under one goal-driven model. eBPF provides kernel-level visibility without application changes; OpenTelemetry keeps instrumentation vendor-neutral.
See your experience goals go live.
An instrumented PoC on your real BFSI, OTT or SaaS journeys.